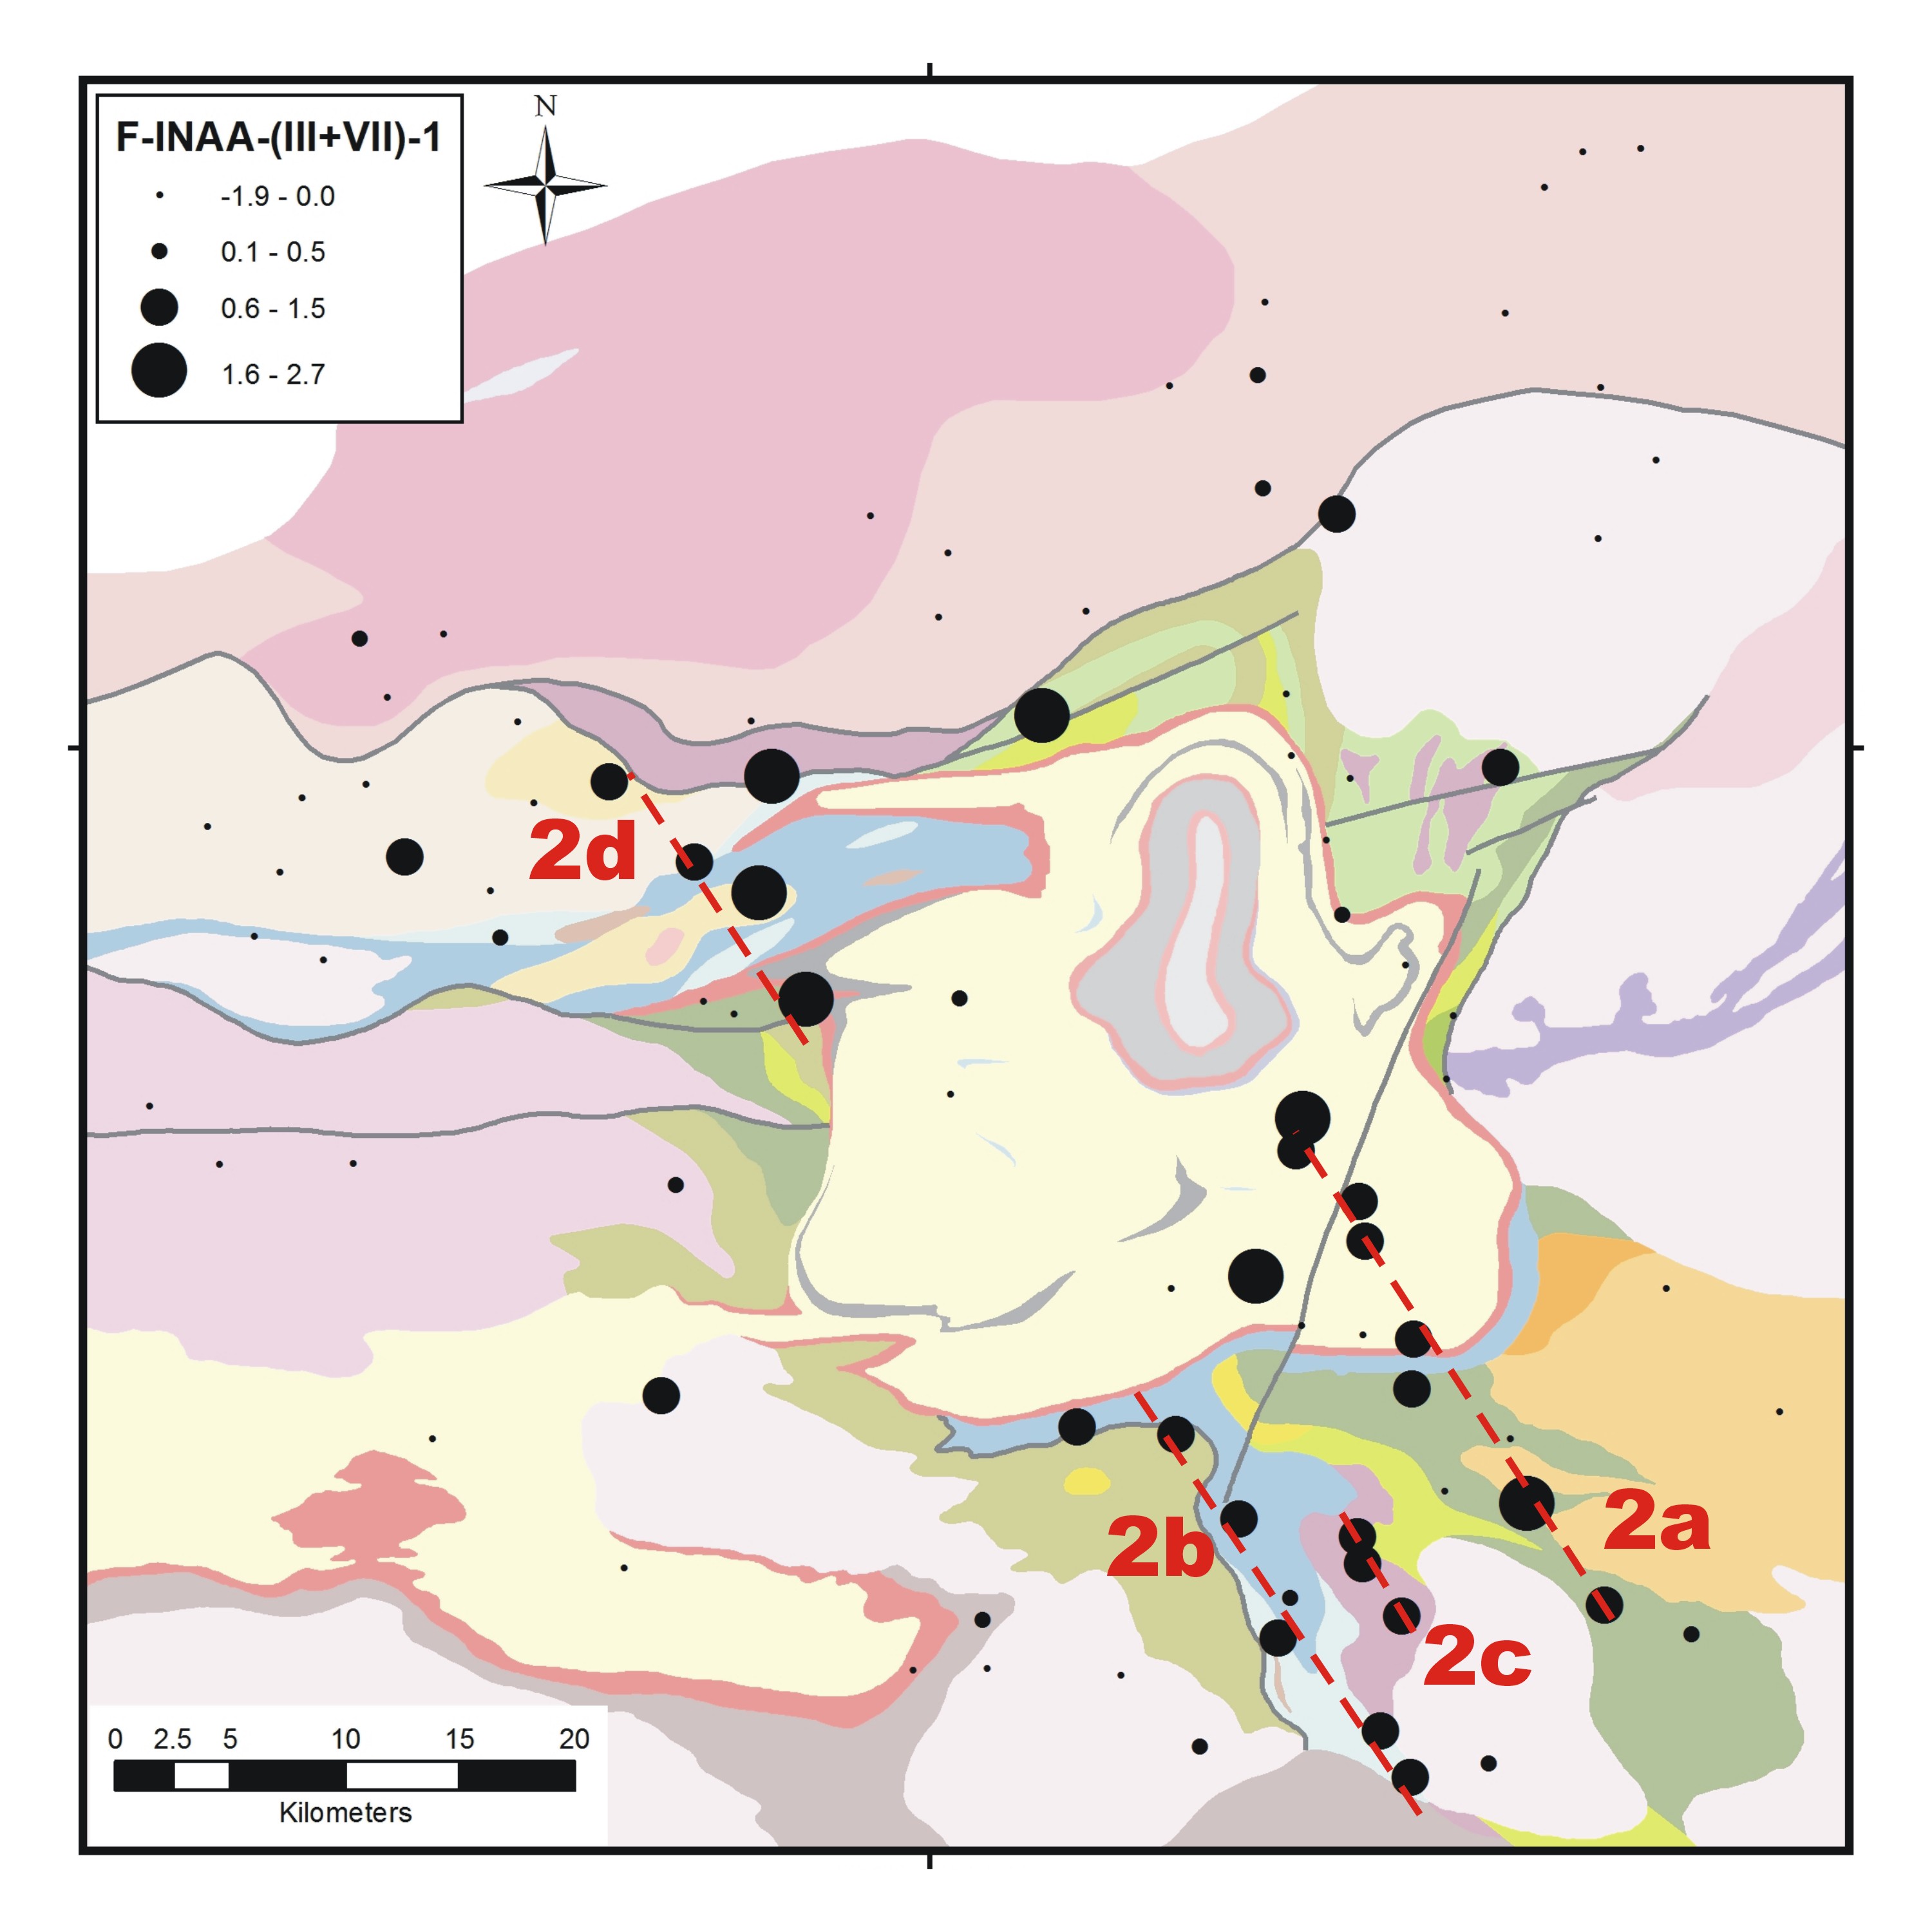
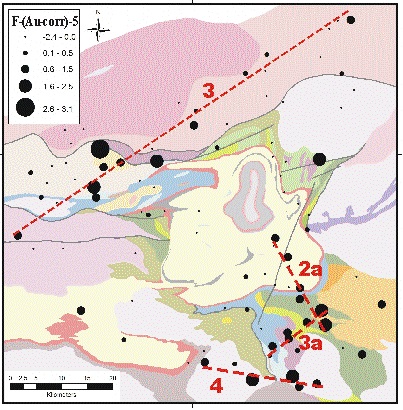
Data    reinterpretation
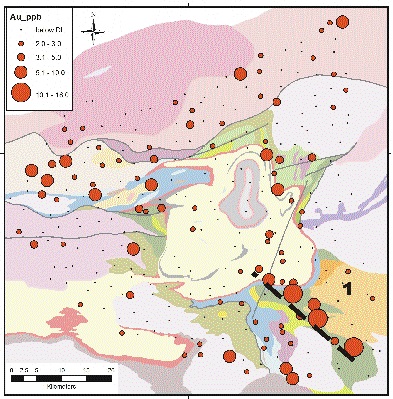
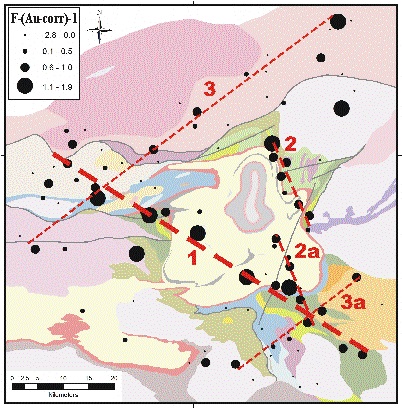
Multi-element statistical analysis permits minimization of geochemical noise and definition of factors responsible for  mineralization processes. Below is an example of reinterpretation of a lake sediment survey. The figures are created using the same analytical data.


About
Geochemistry
Gold  is interpreted to be present in faults (Factor A)
Factor B for gold is interpreted to be associated with sulfides in faults

Visualization
  • Geochemical surveys
  • Environmental studies
  • Mineral exploration
  • 3D models
  • Maps
  • Video clips
  • Reinterpretation of analytical data
  • Surficial reserve evaluation
Home
Clients
Contacts
Plot for gold using raw analytical data

Reinterpreted data for gold shows several processes that have been involved in the spatial distribution of gold within the survey area

Factor C is assumed to identify gold assosiated with sulfides in mafic-ultramafic rocks.
 The trend of these linears is parallel to gabbro dykes inferred from magnetic data.

Reinterpreted   data
Raw data
Contacts
  • Multi-element      statistics
  • Surficial reserve evaluation
Au  ppb
Factor  A
Factor  A
Factor  C
Factor  B
The  report on
lake sediment data interpretation
is available here:


Interpretation